BTC since the beggining
After managing to surpass the rising channel that had been above 13,000 points since March, it has led to an unprecedented rally.
The guideline has gone from having 12 degrees to maintaining more than 45 degrees, resulting in a highly speculative guideline.
Many short positions entered after passing the 1,618 fibonacci compared to the previous maximum of 13,000 points 2 years ago and corresponding to 100% of the fall compared to the beginning of 2018. This was already setting the alarms on before the possible sudden fall of this asset.
In 20,000 many short positions would enter that have eaten losses of 50% of the value in case of not being leveraged, many in fear would close positions when crossing 33,000 and other brave ones would raise them. Now it seems that the BTC rally has come to an end but this will not happen until it clearly loses 30,000 points and the key guideline that is not yet lost.
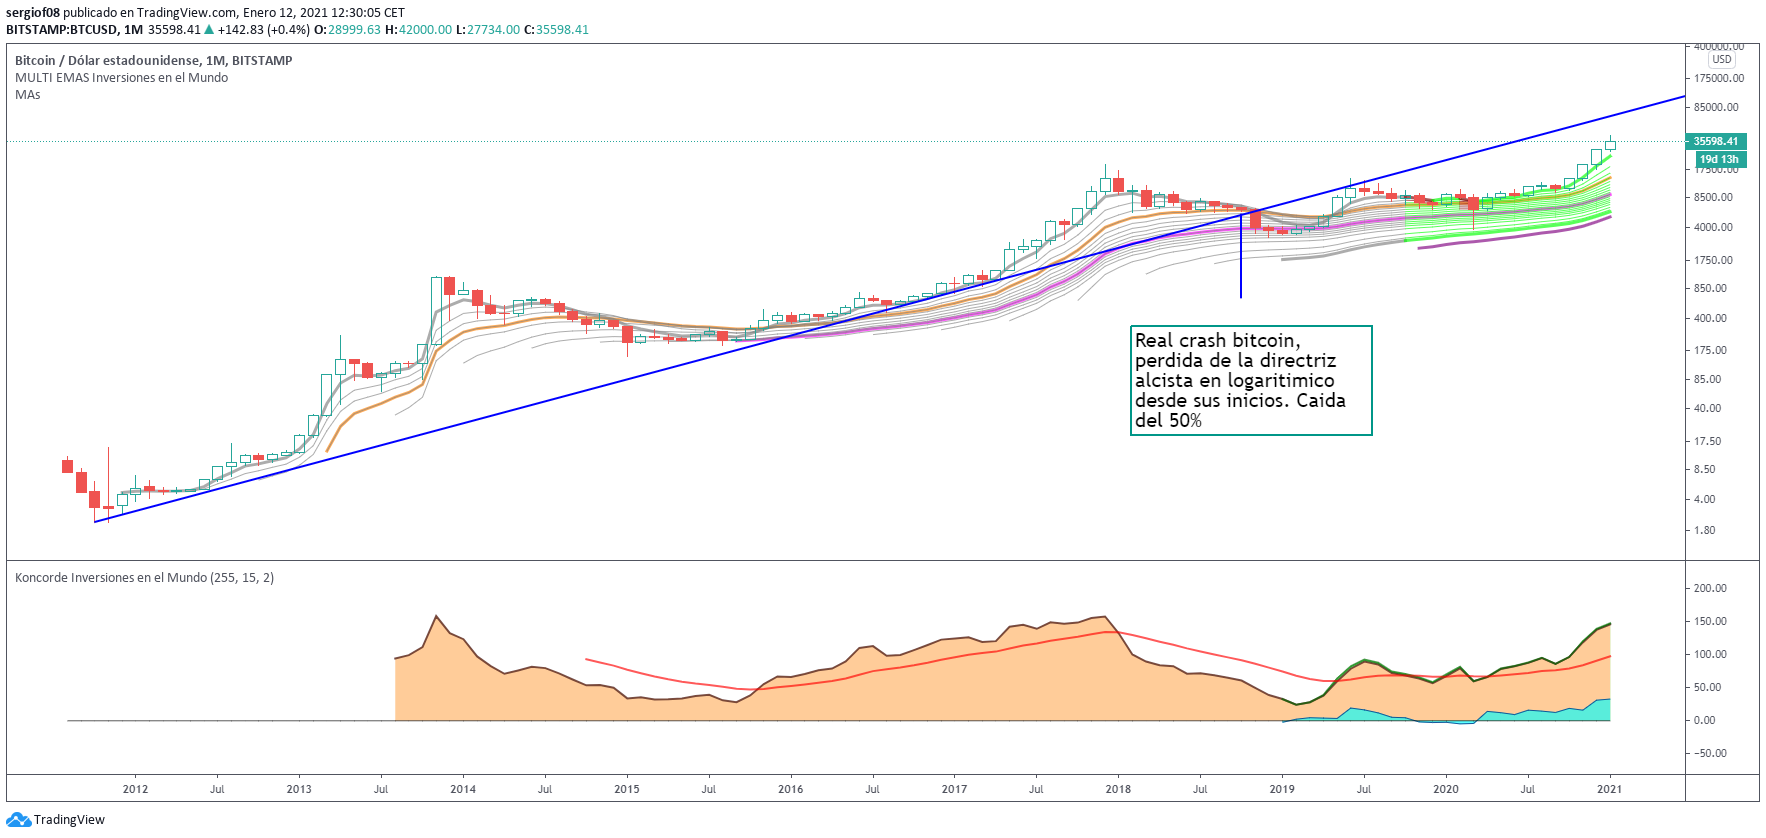
Next I present the graph of the BTC from its beginnings where it is seen how when losing the bullish guideline the BTC made a big retreat, that guideline with such a large angle is difficult to touch since it would indicate that the BTC would be worth $ 100,000 . Also the axis is logarithmic. But it marks a turning point, now the angle of climb will decrease as time progresses.
What is expected of BTC now after having beaten $ 40,000?
The bitcoin has corrected these last 5 days about 25% of the previous highs and is now recovering 50% of that fall.
This may be the opportunity to get away with big profits and forget about it for a while. After an exponential rise that speaking of BTC everything is possible since it is not based on any physical asset but is a purely market good that is freely exchanged. Strong hands direct you and only they know where you are going to be at all times.
It can be seen how
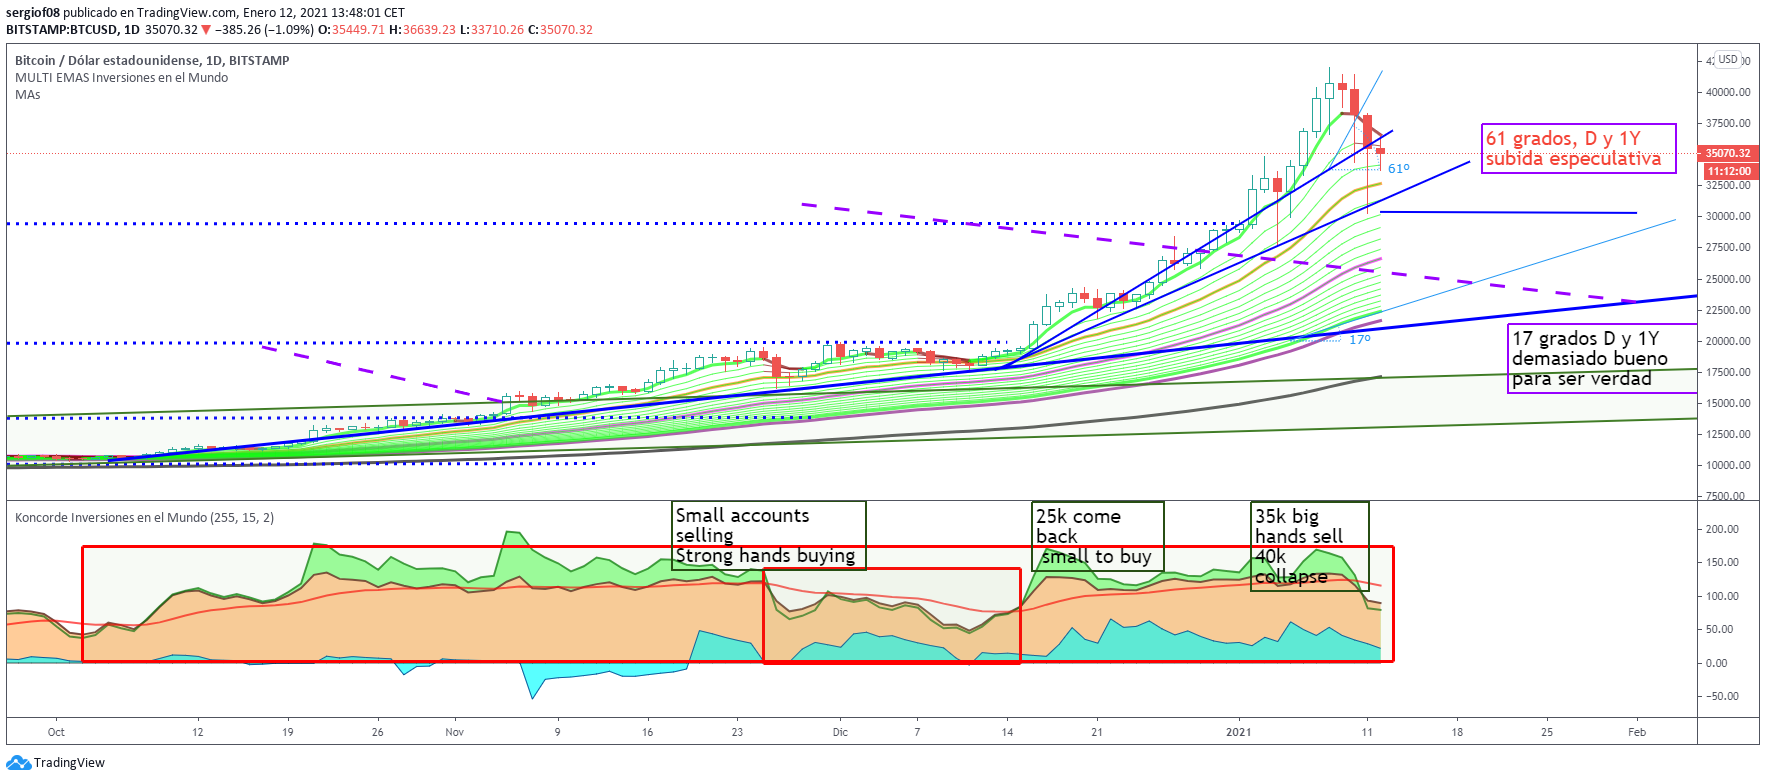
from 20,000 many people sold their bitcoins before the correction that was expected and it is that weak hands are almost always wrong with what can happen more even when we have something that is not supported for no physical good. Many would go short and have suffered great losses since in 30,000 many accounts in short would close positions and the BTC would hit a big impulse until it rose above 40,000 points, In fibonacci the maximum it could reach according to the pattern was 45,000 but it has not reached them. The next step would already be very close to $ 100,000 and the risk being very high.
In 25,000 new minnows or small accounts they would continue to buy gradually and
it is after 35,000 when institutional hands have stopped buying with the same hardness and have started to sell as can be seen in the Konkorde indicator.
Right now, be very careful to lose the 30,000 and especially the 21,000, which is where the normal bullish guideline passes starting in March 2020. If you want to get on with some security, I would recommend waiting for 20,000, and it takes 1 month or 1 year. and there start small purchases, and wait for their evolution, if it falls the most sensible thing would be to wait for the next levels, 13,000, 10,000 and 8000.
Of 8,000 I don't think it will go down and that is where you could put up to 50% of what you expect to put in order to put the rest in case of rise and that a new pattern of rise is formed. In this pattern, it would be necessary to get into it as it beats levels and when it doubles, start selling little by little. It is the only way to earn with these types of assets.
![[Valid RSS]](https://www.onepointsync.com/wp-content/uploads/2016/08/valid-rss-rogers.png "Validate my RSS feed")