Red Eléctrica is a Spanish company that operates in the electricity, supply, management and creation of electricity sector. It owns the entire Spanish high voltage power grid, some 40,000 km of lines, more than 5,000 substations and more than 80,000 MVA of transformation capacity.
It was founded in 1985 and unlike its competitors is only responsible for the transport of electricity and not gas.
Like its competitors, it has a presence in South America since the late 1990s, with a large presence in Chile, Peru and Ecuador.
| ### | 2014 | 2015 | 2016 | 2017 | 2018 |
|---|---|---|---|---|---|
| Debt/ Cash company | Total Debt (M) | 4.683 | 4.792 | 4.950 | 4.905 | 5.408 |
| Beneficio/valor acción | |||||
| Capitalization(M) | - | 10.430 | 9.698 | 10.123 | 10.548 |
| EBDITA (M) | 1.385 | 1.458 | 1.486 | 1.519 | 1.532 |
| PER | 15,6 | 18 | 16,5 | 15,7 | 14,5 |
| Net Profit(M) | - | 376 | 454 | -448 | 418 |
| Dividend | 0,75 | 0,8 | 0,85 | 0,91 | 0,98 |
| Profitability per share (%) | 18 | 7 | 7 | 7 | 7 |
| Debt/EBDITA | 3,4 | 3,3 | 3,2 | 3,2 | 3,5 |
From the fundamentals table we can see how the results of the company improve year by year, although slightly. The EBIDTA in 5 years has increased by almost 15%. The dividend remains stable and the debt has risen proportionally to EBDITA.
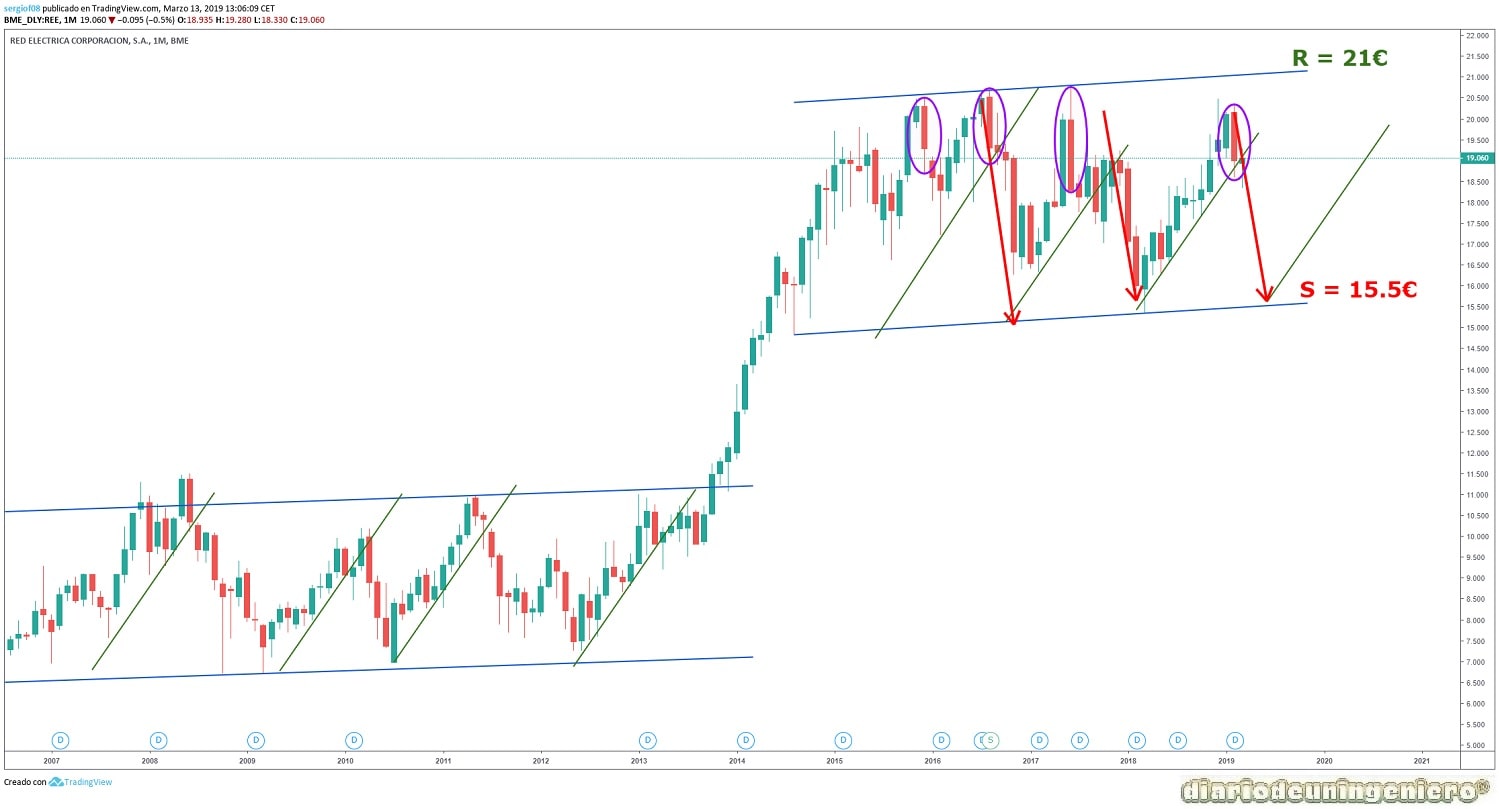
If we look at the long-term chart, we see that the development of stock prices is quite monotonous with a clear pattern of ups and downs. As of 2013, it broke upwards as its profits improved notably but in recent years it has not moved at all from its pattern. The previous increase on the resistance of € 11 would lead to the value to increase its value by 100%, reaching € 20 in 2016.
This value is quite predictable because the technician commands the value since the fundamental data of the company hardly varies. It is usually seasonal, going down and up once a year. Besides, the type of candle in the changes sends and it is very noticeable when there is a black candle. These candles are usually characterized by exceeding the value of the previous month and producing almost all the volume below, with the monthly minimum being lower than the previous one . From this warning candle will follow a large distribution candle as you can see in the chart. In the first case I did not get to touch the support of the channel fixing a little higher but now that it has touched it we already know that it will arrive as little at € 15.5. Because the minima are decreasing, I could still drill a bit more and change the lateral channel to a bearish channel with support still to be determined.
The strategy right now is pretty clear: sell and wait until it reaches a support point . If after a large bearish candle begins to reduce the volume of the next is that it is slowing down and would be the beginning to buy.
© 2016 - All Rights Reserved - Diseñada por Sergio López Martínez
![[Valid RSS]](https://www.onepointsync.com/wp-content/uploads/2016/08/valid-rss-rogers.png "Validate my RSS feed")