Grupo San José esta presente en el sector de la construcción, infraestructura y renovables y a diferencia de otros grupos mucho más grandes como ACS, Sacyr o Ferrovial ha estado más focalizado siempre en el ámbito residencial y inmobiliario. De hecho en el sector de las infraestructuras entraría tras comprar CIMSA en 1992.
No saldrá a bolsa hasta 2009 habiéndose fusionado previamente con la empresa Parquesol. Saldría con un precio de 12,86€. A partir de su salida la empresa lo haría muy mal llegando a tener una deuda acumulada de casi 2.000 millones. Esta deuda sería finalmente refinanciada por los bancos cediendo varios de sus activos al Banco Popular que más tarde serán posesión del Banco Santander. Desde finales de 2012 entraría en un suelo durmiente en torno a 1 euro y no se recuperaría hasta finales de 2016, cuando despertaría de nuevo el sector de la construcción tras una de las peores crisis vividas en nuestro país. Desde entonces la empresa se ha revalorizado un 250% estando actualmente por encima de los 6€.
A continuación presento los datos de fundamentales que me parecen más importantes:
| ### | 2014 | 2015 | 2016 | 2017 | 2018 |
|---|---|---|---|---|---|
| Deuda/ Caja empresa | Total Debt (M) | - | - | - | 67 | 44,3 |
| Beneficio/valor acción | |||||
| Capitalization(M) | 60 | 210 | 230 | 300 | 396 |
| EBDITA (M) | - | - | - | 13 | 13 |
| Net Benefit (M) | - | - | - | 12 | 18 |
| Dividend | |||||
| Profitability per share | |||||
| Debt/EBDITA | 5,5 | 3,38 | |||
The table shows some of the data collected in recent years where the most notable is the reduction of net debt from 350 million after the refinancing agreement in 2014 by banks.
In addition, capitalization has increased considerably, from 60 million in 2015 to almost 400 million today. It has also been awarded large projects, such as Madrid Norte and some state complex as well as being now a candidate for the remodeling of Santiago Bernabeu.
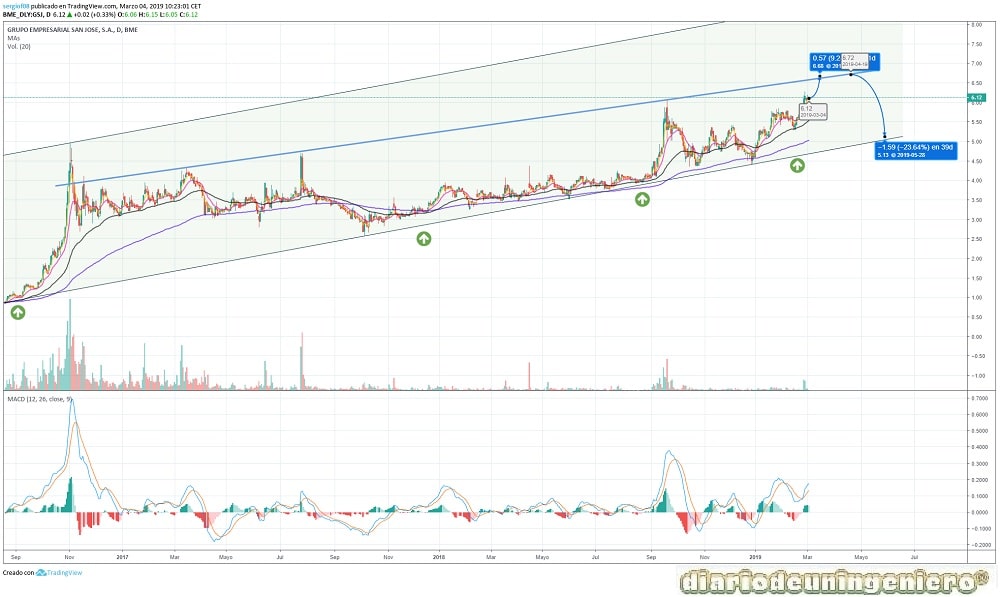
In the long-term chart we see the big rise and how there have been several points when the means are crossed is when the quote starts strongly. The big rise occurred in just a few days with impressive revaluations of more than 50% in several sessions. The maximum came to play the € 5.5 and until after two years, in September of 2017 that value would not be exceeded again. Since then he has drawn a new bullish channel more conservative than the first. Channel that in case of respecting it should not exceed € 6.8 until at least after the summer.
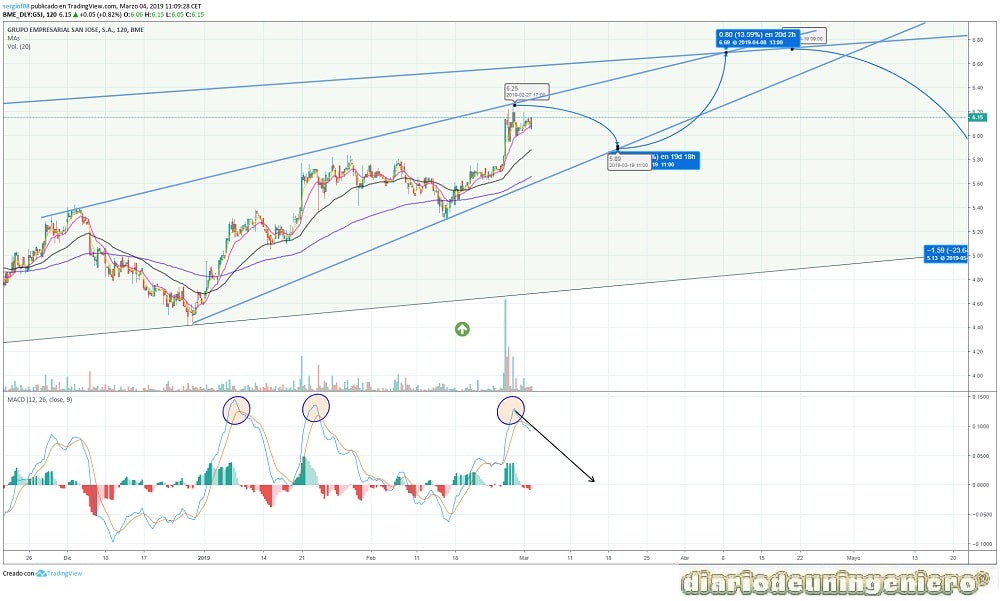
If we analyze the short term we see that it will correct soon to hit the final final impulse. This impulse from the short-term trend line could reach a maximum benefit of 14% and then a final trickle will follow. If we look at the MACD we see that lines have crossed and it is overbought. You must follow the same previous pattern and correct up to the trend line.
© 2016 - All Rights Reserved - Diseñada por Sergio López Martínez
![[Valid RSS]](https://www.onepointsync.com/wp-content/uploads/2016/08/valid-rss-rogers.png "Validate my RSS feed")