| ### | 2014 | 2015 | 2016 | 2017 | 2018 |
|---|---|---|---|---|---|
| Debt/ Cash Company | Total Debt (M) | 5.420 | 4.323 | 4.938 | 4.985 | 5.770 |
| Beneficio/valor acción | |||||
| Capitalization(M) | - | 6.207 | 5.759 | 5.698 | 5.636 |
| EBDITA (M) | 939 | 900 | 882 | 1.013 | 967 |
| PER | 13,5 | 15,1 | 14,5 | 14 | 12,5 |
| Net Profit(M) | 406 | 412 | 417 | 490 | 442 |
| Dividend | 1,3 | 1,32 | 1,39 | 1,46 | 1,53 |
| Debt/EBDITA | 4,32 | 4,7 | 5,76 | 4,3 | 4,42 |
From the fundamentals table we can see how the capitalization has fallen smoothly since 2014 and seems to be stabilizing the results. This is not bad since the company pays a good dividend and although it seems that it does not improve if it does. Being an energetic company, the benefits and stability are usually assured.
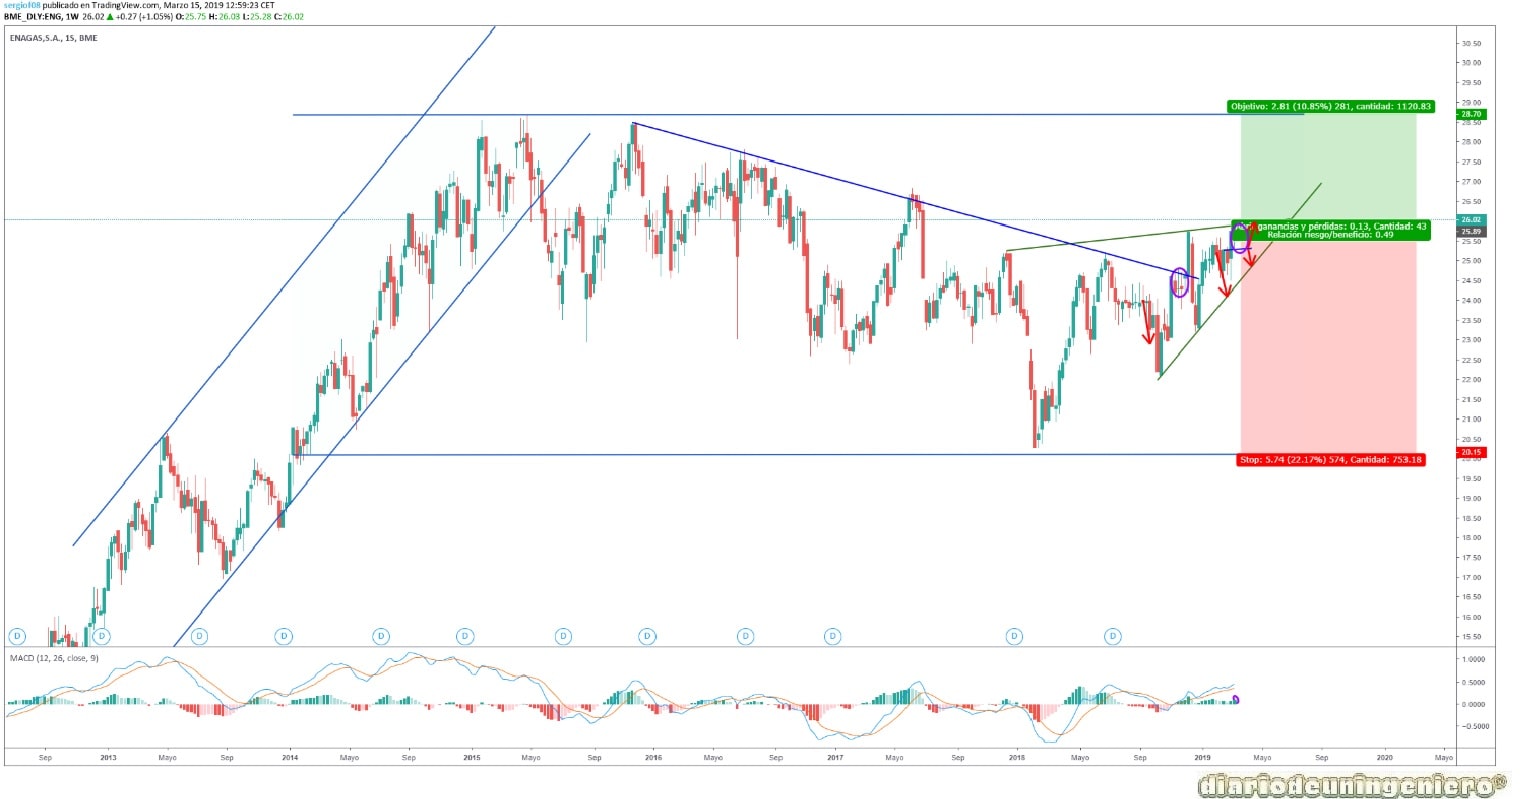
If we look at the long-term chart, we see how relatively recently broke the resistance of the long-term bearish bench in which it had entered after double-roofing around 28 euros in 2015. In that period He could not with the resistance and drew a figure of HCHi without finishing, a very bearish structure since the second shoulder is not superior to the first. Then he would try again in 2016 and could not suffer a big setback going to the environment of € 23. That same year would lose the great resistance around the 23 euros that has the value and is when the alarms would turn on. It would be in May 2018 when it would suffer a free fall that would reach the value to be planted at € 20. A drop of 33% from maximums . From then on, climbing would begin.
It is in this rise that has occurred at the end of 2018 with the presentation of the results of the third quarter of the year when it has strongly broken the resistance and has touched € 25.5. That value is the big goal right now and I'll see it in the short-term chart below.
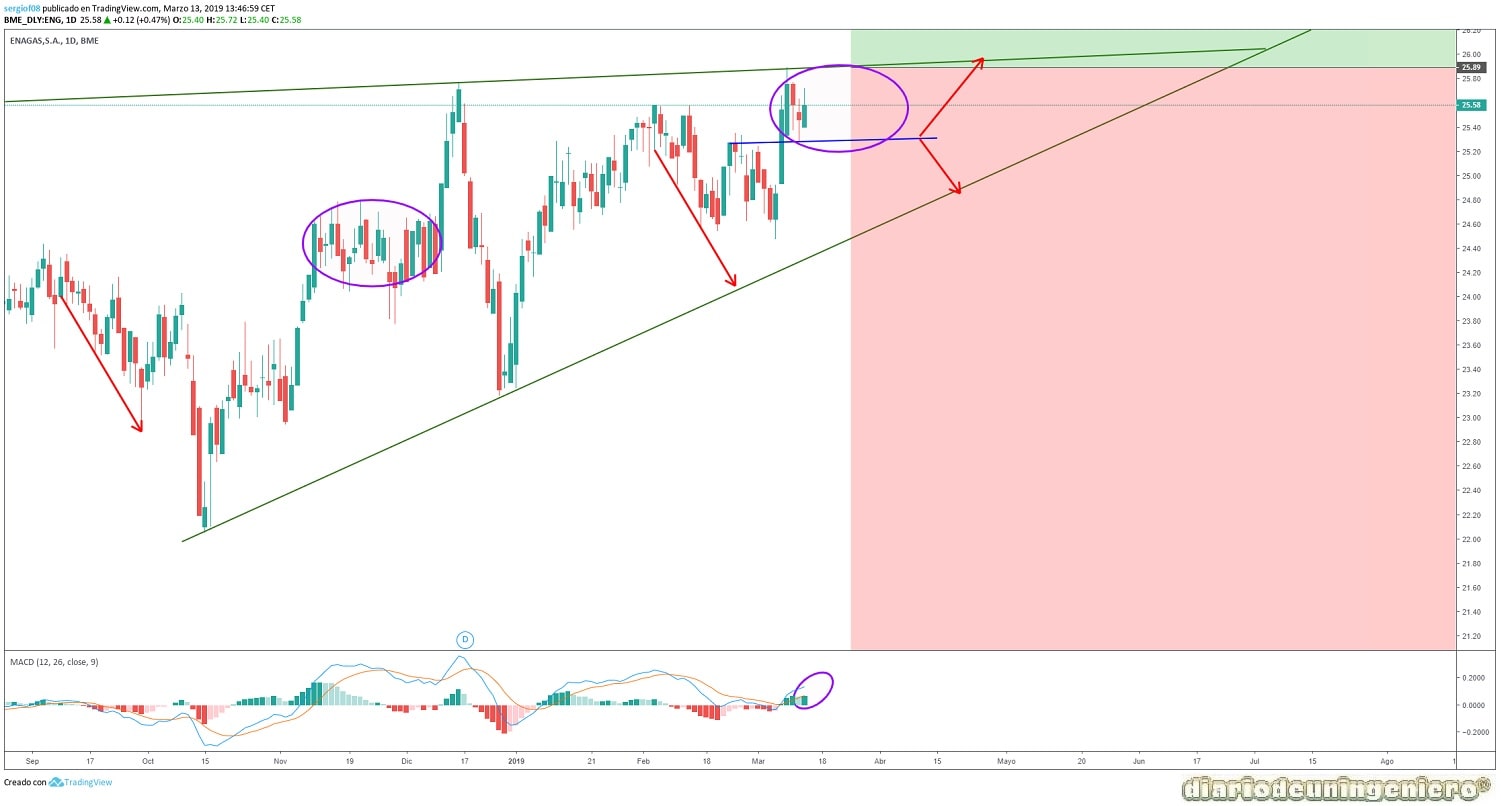
In the short term we observe how the resistance seems to be feeling around the € 26 and it will take a few days to reach it. While this is happening, you can triangulate around the two bands, from € 24.5 and € 26. The structure possible before breaking up could be the one I indicated with purple color. This movement will be upward eventually. It is worth observing the MACD indicator that shows us how the convergence lines at this moment are far from crossing .
© 2016 - All Rights Reserved - Diseñada por Sergio López Martínez
![[Valid RSS]](https://www.onepointsync.com/wp-content/uploads/2016/08/valid-rss-rogers.png "Validate my RSS feed")