Acciona is a Spanish company dedicated to the construction and infrastructure sector and the energy sector. It comes from the merger of Cubiertas and MZOV (merger between the company of Ferrocarriles de Medina del Campo to Zamora ... and Cubiertas y Tejados SA that occurred in 1968) and Entrecanales and Tavora that It took place in 1997.
In 2002, he would buy the shipping company Transmediterranea. In December of 2003 under the mandate of Jose Maria Aznar, the president of the company would be named president of EHN, and later it would also absorb this company.
It has a large presence in the infrastructure sector, especially in those of an industrial nature. In addition, he is also involved in water management, with the construction of desalination plants, which he currently rivals the Spanish company Abengoa in a multitude of new projects. It should be noted that Abengoa and Acciona not only compete in projects, but also in commercial partners, because if in the Middle East they are carrying out many desalination plants in South America, they compete in the electric power and renewable energy management projects. A merger between the two or the absorption of Abengoa by Acciona in less than 5 years through a tender offer would not be negligible.
Currently the company is controlled by the founders of the company, the family entrecanals that have almost 60% shareholding.
Here I present the data of fundamentals that I think are most important:
| ### | 2015 | 2016 | 2017 | 2018 | 2019 |
|---|---|---|---|---|---|
| Debt/ Company cash | Deuda Total (M) | - | 5.131 | 5.471 | 4.688 | 4.600 |
| Benefits/value share | |||||
| Capitalization(M) | 4.528 | 4.004 | 3.895 | 4.231 | 5.147 |
| EBDITA (M) | - | 1.192 | 1.275 | 1.242 | 1.189 |
| PER | - | 14,41 | 20,44 | 22,46 | 18,78 |
| Net Benefit (M) | - | 352 | 220 | 328 | 257 |
| Dividend | - | 2,88 | 3,0 | 3,25 | 3,25 |
| Profitability per share (%) | - | 7,72 | 4,4 | 4,16 | 3,34 |
| Debt/EBDITA | - | 4,3 | 4,3 | 3,76 | 3,86 |
Currently has an impeccable behavior and is shown in the improvement of its results from year to year. It stands out due to a very low debt balance with respect to EBDITA and very high net benefits sustained over time. These benefits represent almost 10% of its capitalization on the stock market and allow it to report a succulent annual dividend to its shareholders that is around 3%. To make matters worse, the price is about to triple its price since 2012, which was at € 30 as will be seen below.
In the graph you will see how the rise of recent years has been calmer and the market accommodated quite well. Nothing to do with the speculative rise that occurred since 2003 with the construction bubble in Spain.
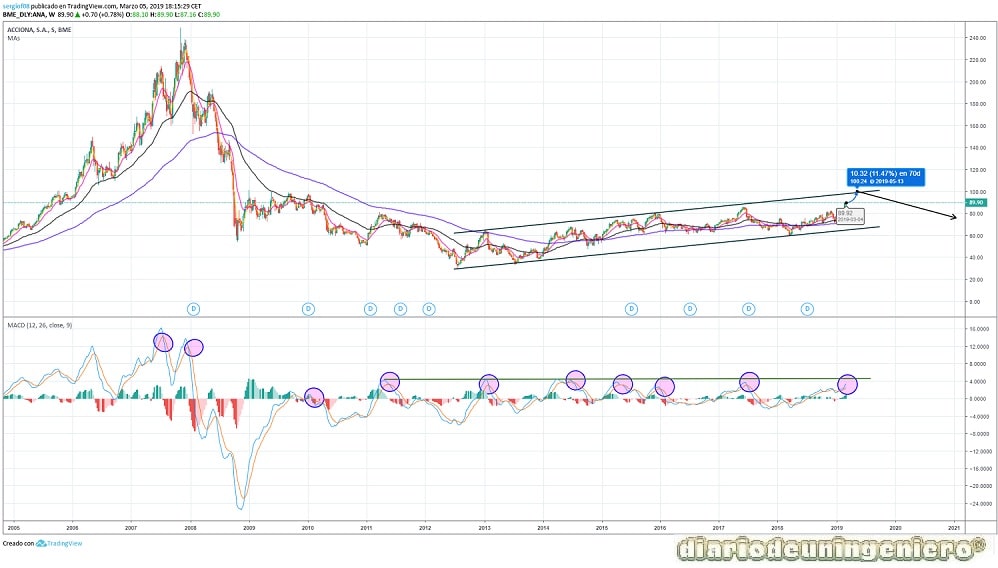
In the long-term chart we can see the big drop that occurred at the end of 2007 and the speculative rise that would be formed just before knowing what was happening in Spain and the world. Very typical behavior of the end of bubbles which would begin at the end of 2006 from around € 120. From the fall it would hold this value for almost two years to yield to the selling pressure and lose more than 50% of the value going from € 80 to € 30. This value that is at € 120 is considered by many the value to beat.
If we look at the MACD indicator, we can see that since 2012, all of Acciona's large falls would be reflected here and therefore in the ACD (distributor accumulator) and in the RSI. There is a threshold that always warns of the descent. Right now they are about to cross the lines which would indicate the return to a setback in the price to be able to rise again. And there are healthy downloads as in this case where you need to re-enter many purchases .
There will be two possibilities, a somewhat abrupt drop in which you want to touch support for quick purchases and change of hands or on the other hand a very slight drop or a stabilization of the quote that will inexorably lead to returns.
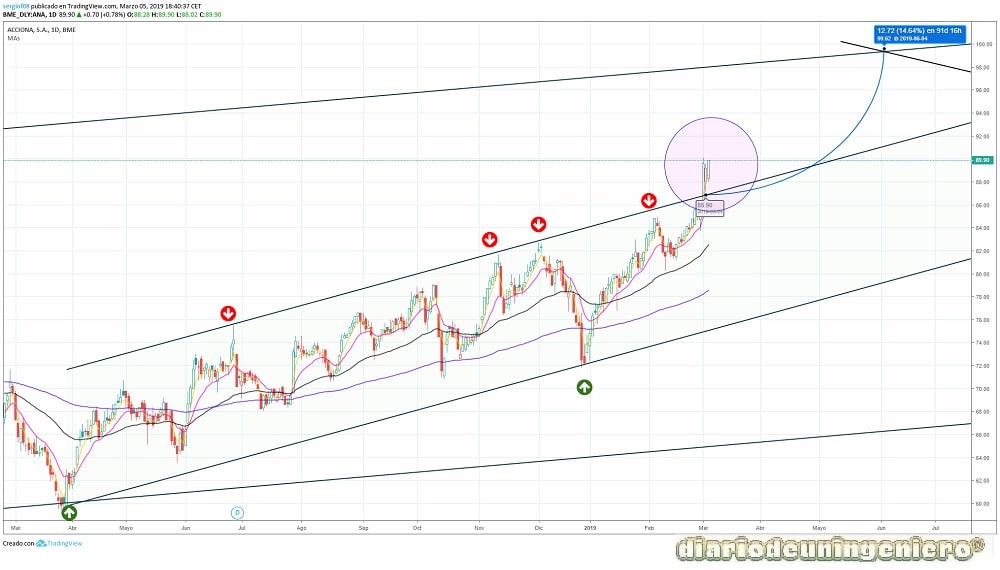
In the short-term chart we find a mini-channel within the long-term trend channel carried out last year. In this chart we see how there has been a trend change flag in which it is seen that Acciona is doing better than the market demands. This causes that you want to touch the high line much faster because in the long graph with the previous behavior you would expect an ascent to maximums at the end of 2019 or the beginning of 2020. In this case it could be before the summer of 2019 when will reach this level. In part, this increase is due to the recent large mega-contract awards, especially the millionaire desalination projects in Saudi Arabia.
© 2016 - All Rights Reserved - Diseñada por Sergio López Martínez
![[Valid RSS]](https://www.onepointsync.com/wp-content/uploads/2016/08/valid-rss-rogers.png "Validate my RSS feed")