IAG is the only transport company of the IBEX35 and consists of the merger of three airlines. Two Spanish companies, such as IBERIA and Vueling, and another British company, British Airways. The company currently enjoys very good financial health after the restructuring in 2011. Each year the benefits have increased, having done it in a spectacular way in the last four years. With increases ranging from 10% to 50% per year, having gone from 800 million in 2014 to almost 2500 in 2018, that is, multiplying its value by five.
The EBDITA has also increased doubling his value in 4 years. The debt in turn has been reduced by 15% but what is more important is that having generating benefit has allow to pay de debt easily. Comparing the EBDITA with the debt we get a very low ratio, around 0.3 that could be the envy of many companies of the selective as Telefonica.
If we go to the plane of the future the company has very good financial strength and very well positioned against its rivals in terms of airports where it operates. In recent times the intention of the purchase of Norwegian has been revealed, which has triggered the price of the latter. If consummated it would be very good news for IAG. In addition, a transatlantic low-cost regular line plan is being implemented, which could offer cheap tickets to connect mainly the United States and Spain or South America and Spain at lower prices. However, due to the monopoly that it presents in South America in some countries, I see more feasible that this is put into practice before the United States because it has more rivals there.
As doubts present in the value is the Brexit that even being already initiated the doubts on the execution are diverse and I do not believe that this all clear until at least the 2020.
Below I present the data of fundamentals that I find most important:
| ### | 2014 | 2015 | 2016 | 2017 | 2018 |
|---|---|---|---|---|---|
| Debt/ Cash company | Total debt (M) | 1.673 | 1.453 | 2.293 | 1.662 | 1.359 |
| Benefit/Share Value | |||||
| Capitalización(M) | - | 12.628 | 16.881 | 10.940 | 15.434 |
| EBDITA (M) | 2.586 | 3.642 | 3.822 | 4.199 | 4.434 |
| PER | 18,45 | 10,11 | 8,89 | 9,11 | 8,58 |
| Net Benefit (M) | 797 | 1.495 | 1.952 | 2.021 | 2.406 |
| Dividend | - | 0.20 | 0,24 | 0,27 | 0,29 |
| Profitability per share | - | 2,71% | 3,18% | 3,66% | 3,98% |
| Debt/EBDITA | 0,64 | 0,39 | 0,6 | 0,39 | 0,306 |
Looking at the long-term chart, we observe the different phases in which IAG has moved.
The first phase would be a cycle of rebound read about the crisis that occurred in the company and part of the IBEX35 in 2012. It shows how that rise at its highest point reached a 256% return on the lows of 1, € 8 Then I would make a correction to complete the maturity and the accommodation of the value arriving at € 8. This vertical rise came hand in hand with the new results of IAG Express, the IAG section of low cost flights that were going to compete with airlines such as Rayanair and EasyJet. From here in 2015 the price would rise, influenced by the drop in the price of oil.
It would have a primary correction decline due to the strong rise experienced and there would be at the expense of the Brexit result that according to many analysts would be a before and after. The Brexit would come out an unexpected result and as a result the value would be heavily punished leaving almost 40% of the value quote, going from € 7 to € 5 on the first day after the Brexit and reaching € 4 in the second being the most punished value of the IBEX35.
From here it would begin to rise slowly and in less than 1 year it would recover almost its original value before the Brexit, rising almost 85% from minimums. A company that worked so well would not lose those values for just a political result. Having seen the Brexit has lasted almost two years without application and without a clear horizon and in that time there has been no notable change at the level of operation of the company, so it was not all more than a good time to exchange stickers and enter the value.
From here the value has been oscillating between the support of € 6 and the previous maximum, € 8.3 that correspond to the contribution ceiling.
On a global level the technician does not look too good in the long term, as long as he does not give signals of a channel exit.

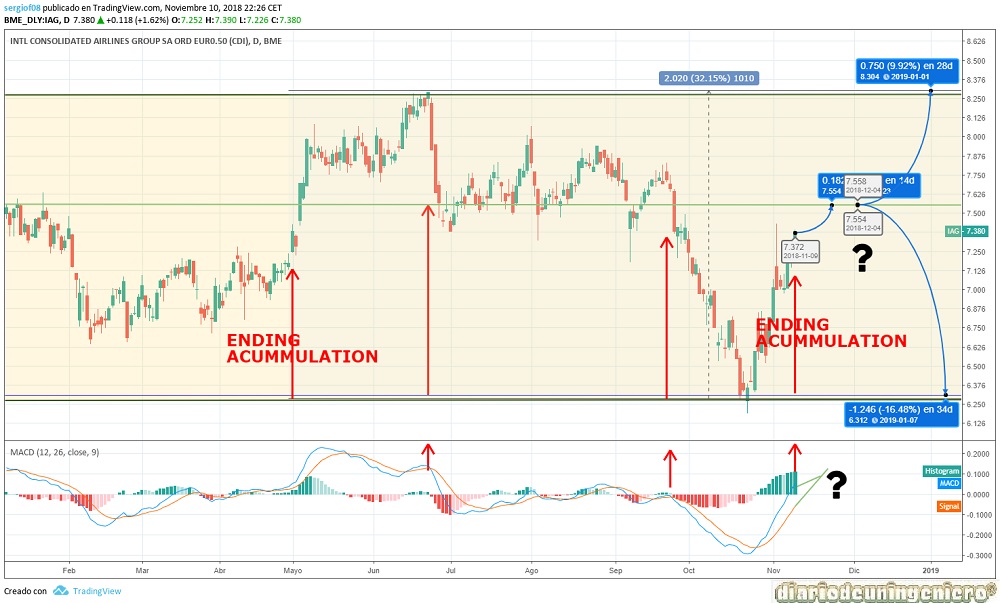
If we look at the short-term chart we see that since the end of August, the price has fallen due to the rise in crude and has rebounded in the historical support of 6.2 €.
At this time it would be much more cautious to wait for possible falls of the value around the previous support since the risk of a fall is high and the possibility of climbing to the roof are scarce, having only a 10% rise in maximums.
© 2016 - All Rights Reserved - Diseñada por Sergio López Martínez
![[Valid RSS]](https://www.onepointsync.com/wp-content/uploads/2016/08/valid-rss-rogers.png "Validate my RSS feed")